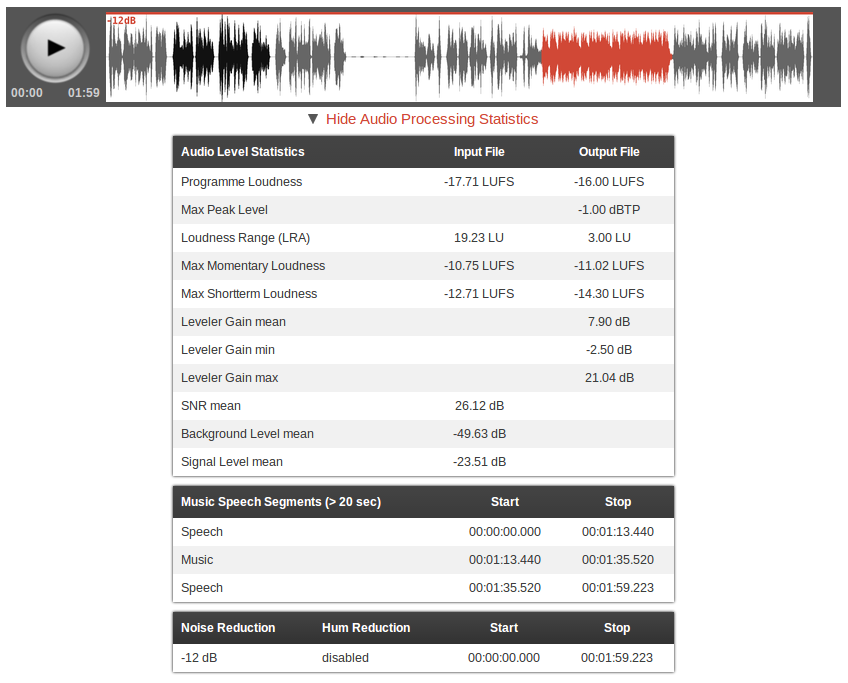
A few days ago we added audio processing statistics to Auphonic productions, which display details about what our algorithms are changing in your audio file.
Some classifier results and processing steps are also shown directly in the player audio waveform and all statistics can be exported via the
Auphonic API or the new output file format Audio Processing Statistics.
This article explains how to use and interpret the Auphonic Audio Processing Statistics.
UPDATE 2017:
Some information here is outdated - please see the documentation of our new audio processing statistics and inspector instead:
Auphonic Audio Inspector Help

Statistics Tables
After the processing of a production is finished, you can click on Show Audio Processing Statistics (below the audio player) to display tables with statistics:

Then you will see one or multiple tables, depending on which algorithms are activated:
- Audio Level Statistics Table:
-
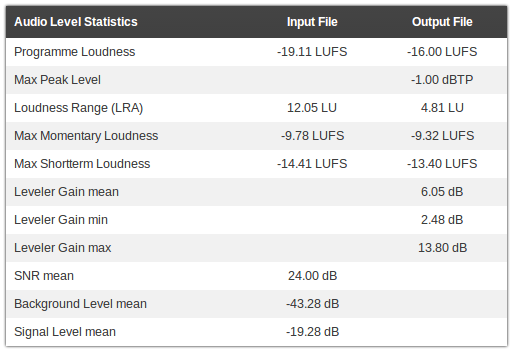
This table lists information about the loudness and levels of your input and output audio signal.
It can be used to check compliance with loudness standards (Programme Loudness, Maximum True Peak Level, Loudness Range - see EBU TECH 3341, Section 1) and certain regulations for commercials (Max Momentary Loudness (400ms integration time), Max Shortterm Loudness (3sec integration time) - see EBU TECH 3341, Section 2.2).
It also shows how much our Adaptive Leveler changes your levels (Leveler Gain mean, min, max) and statistics about your input audio signal (SNR (Signal-to-Noise Ratio), Background Level, Signal Level). - Music Speech Segments Table:
- Lists music and speech segments in your output audio files, which are 20 seconds or longer.
- Noise and Hum Reduction Table:
- Lists how much Noise Reduction and/or Hum Reduction was used in which segments of your output audio files.


Waveform Image
Some data is also directly shown in the waveform of our audio player.
A normal speech signal is displayed in gray, a music signal in red and segments with high amplifications of the Adaptive Leveler are black:

Red lines at the top of the waveform image
represent segments where Noise Reduction is activated. The noise reduction amount is displayed in dB.
Red lines at the bottom show regions with activated Hum Reduction and the classified hum base frequency:

Statistics in Output File and API Response
All audio processing statistics are also avaiable as a separate output file format and in the Auphonic API response.
The Auphonic API enables you to query all details about a production in a machine readable JSON or XML format, also processing statistics including units:
...
"statistics": {
    "levels": {
        "input": {
            "lra": [19.23, "LU"],
            "noise_level": [-49.63, "dB"],
            "max_momentary": [-10.75, "LUFS"],
            "signal_level": [-23.51, "dB"],
            "snr": [26.12, "dB"],
            "max_shortterm": [-12.71, "LUFS"],
            "loudness": [-17.71, "LUFS"]
        },
        "output": {
            "lra": [3.0, "LU"],
            "max_shortterm": [-14.3, "LUFS"],
            "max_momentary": [-11.02, "LUFS"],
            "gain_min": [-2.5, "dB"],
            "peak": [-1.0, "dBTP"],
            "gain_mean": [7.9, "dB"],
            "loudness": [-16.0, "LUFS"],
            "gain_max": [21.04, "dB"]
        }
    },
    "music_speech": [
        {"label": "speech", "start": "00:00:00.000", "start_sec": 0.0, "stop": "00:01:13.440", "stop_sec": 73.44},
        {"label": "music", "start": "00:01:13.440", "start_sec": 73.44, "stop": "00:01:35.520", "stop_sec": 95.52},
        {"label": "speech", "start": "00:01:35.520", "start_sec": 95.52, "stop": "00:01:59.223", "stop_sec": 119.224}
    ],
    "noise_hum_reduction": [
        {"denoise": -12, "dehum": false, "start": "00:00:00.000", "start_sec": 0.0, "stop": "00:01:01.528", "stop_sec": 61.528},
        {"denoise": false, "dehum": false, "start": "00:01:01.528", "start_sec": 61.528, "stop": "00:01:59.223", "stop_sec": 119.224}
    ]
}
...
Furthermore it's possible to export processing statistics as a separate output file: add Audio Processing Statistics as an additional output file in the Auphonic production form.
This file is available in JSON (same format as the API response example above), in YAML, or in a more human readable text format:
my_filename.wav

Input File
- lra: 19.29 LU
- noise_level: -48.94 dB
- max_momentary: -10.73 LUFS
- signal_level: -23.33 dB
- snr: 25.61 dB
- max_shortterm: -12.58 LUFS
- loudness: -17.60 LUFS

Output File
- lra: 3.09 LU
- max_shortterm: -14.27 LUFS
- max_momentary: -10.67 LUFS
- gain_min: -2.80 dB
- peak: -1.00 dBTP
- gain_mean: 7.72 dB
- loudness: -16.00 LUFS
- gain_max: 20.57 dB

Music Speech Segments
- 00:00:00.000->00:01:13.440: Speech
- 00:01:13.440->00:01:35.520: Music
- 00:01:35.520->00:01:59.420: Speech

Noise and Hum Reduction
- 00:00:00.000->00:01:59.420: denoise -12dB, no dehum
Conclusion
The Auphonic audio processing statistics show some details about what our algorithms are doing in your audio files.
This can be used to identify problematic segments and check them manually, to control if some input files have a very bad quality (SNR), to be compliant with regulations for commercials (Max Shortterm Loudness) and much more.
Please let us know, if you discover any mistakes or problematic segments in an audio file, we added a simple feedback mechanism below the statistics tables. Then we can use the data to train our classifiers and our audio algorithms will improve over time!